 Free State Drivers
As of late The FSD Tech Penguin has received many questions on the topic of taper and The Forest Projection and Planning system (FPS). This is not an insignificant topic as FPS is somewhat unique in how it determines taper. This post will serve as a quick discussion of what FSD understands about the taper system in FPS and may not be 100% accurate. However, this level of accuracy is based on a lack of available documentation and the fact that FPS is held as highly proprietary and completely non-open. This means that the source code is not available and this knowledge comes from FSD attending several calibration workshops. At this point we recommend getting some strong coffee…
Brief Background
First a little about the FPS model. This is a topic that should be covered in another post however that will take some time so this brief description will have to suffice for now.
The FPS model is advertised as an individual tree distance dependant tree model (based on the classification system by Murno, 1974). This means that all trees are grown individually based on the spatial pattern of the stand.
So you need to provide FPS the spatial location of all trees? NO. FPS will generate a spatial pattern based on the attributes of the trees in question and the clumpiness. Clumpiness is outside the scope of this discussion bu is based on the variance between plots sampled.
The FPS model is also advertised as being a “non-parametric” model. For FPS this means that all data for growth is stored in a series of lookup tables in the main FPS folder in a file called either Species.Lib (for very old versions) or FBRI_Lib.MDB/FBRI7_Lib.MDB.
Taper
What is taper in FPS? Taper is defined in the world of FPS and the height at 80% of DBH. This value is then represented in %. For a test of reasonable a typical taper value in fpr would be 0.28 or 28%. This can vary but tapers far below or above that can be a sign of poor taper measurements or calculations.
For the topic of taper two (2) main tables are used. The enigmatic and archaic names and contents of these tables are left over from the text days and the lack of updates to the library structure to meet current database standards.
- TAPACC – Taper Access
- TAPCLS – Taper Class
To simplify this conversation we will assume that taper is not known for a given stem. If taper is known the user could skip directly to the TAPCLS table discussion below.
TAPACC (Taper Access)
When FPS is given a tree with no taper information it will begin the journey to determine taper in the Taper Access (TAPACC) table. As with all tables in FPS this table is broken down into region and species level details. Here is an example of one (1) species in one (1) region:
| Region | Species | Type | Row | Label | Ht06 | Ht12 | Ht18 | Ht24 | Ht30 | Ht36 | Ht42 | Ht48 | Ht54 | Ht60 | Tally |
| 999 | XX | 31 | 0 | AccRef | 0.256 | 0 | 0 | 0 | 0 | 0 | 0 | 0 | 0 | 0 | 0 |
| 999 | XX | 31 | 1 | Acc033 | 0.299 | 0.295 | 0.291 | 0.287 | 0.284 | 0.28 | 0.276 | 0.272 | 0.268 | 0.264 | 0 |
| 999 | XX | 31 | 2 | Acc066 | 0.293 | 0.288 | 0.283 | 0.277 | 0.272 | 0.266 | 0.261 | 0.255 | 0.249 | 0.244 | 0 |
| 999 | XX | 31 | 3 | Acc100 | 0.287 | 0.281 | 0.274 | 0.266 | 0.259 | 0.252 | 0.245 | 0.239 | 0.232 | 0.225 | 0 |
| 999 | XX | 31 | 4 | Acc133 | 0.281 | 0.273 | 0.264 | 0.256 | 0.247 | 0.239 | 0.231 | 0.222 | 0.213 | 0.205 | 0 |
| 999 | XX | 31 | 5 | Acc166 | 0.275 | 0.265 | 0.255 | 0.245 | 0.236 | 0.225 | 0.215 | 0.205 | 0.196 | 0.186 | 0 |
| 999 | XX | 31 | 6 | Acc200 | 0.269 | 0.257 | 0.245 | 0.235 | 0.223 | 0.211 | 0.2 | 0.189 | 0.177 | 0.166 | 0 |
| 999 | XX | 31 | 7 | Acc233 | 0.269 | 0.257 | 0.245 | 0.235 | 0.223 | 0.211 | 0.2 | 0.189 | 0.177 | 0.166 | 0 |
| 999 | XX | 31 | 8 | Acc266 | 0.269 | 0.257 | 0.245 | 0.235 | 0.223 | 0.211 | 0.2 | 0.189 | 0.177 | 0.166 | 0 |
| 999 | XX | 31 | 9 | Acc300 | 0.269 | 0.257 | 0.245 | 0.235 | 0.223 | 0.211 | 0.2 | 0.189 | 0.177 | 0.166 | 0 |
As the reader can see each region and species combo has two (2) types of information mixed in to the table.
Starting with Row 0 / Label “AccRef”. This has one (1) value listed in this example. The value of 0.256 in Row 0 and Col HT06 should directly correspond to the value in Row 4 Col Ht24. What does this do? This is what the developer of this model call Level 1 Calibration / Localization. In this case the values in the 2 cells are the same and so FPS will not modify the surface. If there had been a difference the difference would have been accounted for and used to shift the whole surface up or down.
Now that FPS has used the AccRef value to offset the Taper Access surface FPS moves to Rows 1 – 9. The values of Rows 7 – 9 remain constant in this example as they are new levels of competition and have not yet been calibrated. So as just stated FPS uses Rows 1 – 9 as levels of competition. The label gives a rough idea of the levels of competition.
| Label | Diameter (cm) / (Height (m) – Breast Height) Ratio | Assumed Status |
| Acc033 | 0.33 | Highly Suppressed |
| Acc066 | 0.66 | Intermediate |
| Acc100 | 1.00 | Co-Dominant |
| Acc133 | 1.33 | Dominant |
| Acc166 | 1.66 | |
| Acc200 | 2.00 | |
| Acc233 | 2.33 | |
| Acc266 | 2.66 | |
| Acc300 | 3.00 | Open Grown |
FPS will not determine the D/(H – BH) ratio and interpolate through the table to determine the taper. This is done with the FpSlip.dll file. The resulting taper value will be used to access the taper class (TAPCLS) table.
The Tally field is to be populated by the biometrician doing the calibration with the total number of stems that have been used to calibrate this data.
TAPCLS (Taper Class)
This table is the full set of taper profiles for a species and region. As with all tables in FPS this table is broken down into region and species level details. Here is an example of one (1) species in one (1) region:
| Region | Species | Type | Row | Label | Rd10 | Rd9 | Rd8 | Rd7 | Rd6 | Rd5 | Rd4 | Rd3 | Rd2 | Rd1 | Rd0 | Tally |
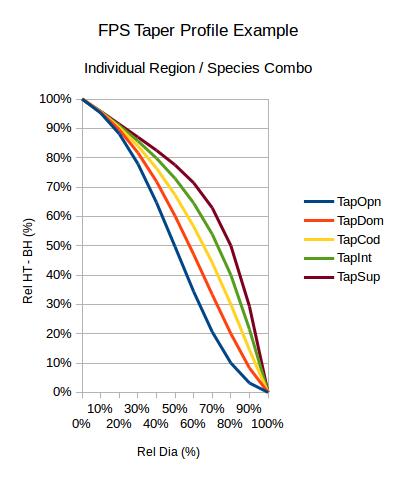
| 999 | XX | 32 | 1 | TapOpn | 0 | 0.032 | 0.1 | 0.206 | 0.343 | 0.496 | 0.647 | 0.779 | 0.881 | 0.952 | 1 | 0 |
| 999 | XX | 32 | 2 | TapDom | 0 | 0.083 | 0.2 | 0.333 | 0.47 | 0.601 | 0.719 | 0.817 | 0.895 | 0.955 | 1 | 0 |
| 999 | XX | 32 | 3 | TapCod | 0 | 0.145 | 0.3 | 0.442 | 0.565 | 0.673 | 0.764 | 0.84 | 0.903 | 0.956 | 1 | 0 |
| 999 | XX | 32 | 4 | TapInt | 0 | 0.215 | 0.4 | 0.539 | 0.645 | 0.729 | 0.798 | 0.857 | 0.909 | 0.957 | 1 | 0 |
| 999 | XX | 32 | 5 | TapSup | 0 | 0.293 | 0.5 | 0.629 | 0.714 | 0.775 | 0.825 | 0.87 | 0.914 | 0.958 | 1 | 0 |
| 999 | XX | 33 | 1 | BrkOpn | 0.906 | 0.904 | 0.901 | 0.899 | 0.896 | 0.893 | 0.891 | 0.888 | 0.885 | 0.882 | 0.881 | 0 |
| 999 | XX | 33 | 2 | BrkCod | 0.916 | 0.914 | 0.913 | 0.911 | 0.909 | 0.907 | 0.906 | 0.904 | 0.902 | 0.899 | 0.899 | 0 |
| 999 | XX | 33 | 3 | BrkSup | 0.915 | 0.913 | 0.91 | 0.907 | 0.904 | 0.902 | 0.899 | 0.896 | 0.893 | 0.89 | 0.889 | 0 |
Again the reader can see that there are multiple types of data in this table. Both the taper(Tap) and bark(Brk) profiles are included in this table. The focus here will be only on the taper.
The Tally field is to be populated by the biometrician doing the calibration with the total number of stems that have been used to calibrate this data.
Weather FPS calculated the taper or the taper was user defined FPS will now use the value (say 30% or 0.3 for this example) to look up the status of the tree in the Rd8 column. These column headers are to mean the relative height – breast height at a given relative diameter (Rd% so Rd8 = Rel Dia @ 80% DBH) for a given level of taper. So one could graph these surfaces directly in their favorite graphing program. This species region combo looks like this:
FPS will interpolate between surfaces to get the exact surface required. This is done with the FpSlip.dll file.
Now that FPS has the exact taper profile the FPS merchandized routine can “buck” the tree into logs and determine the volume both Scribner Dec C and using Newton’s formula.
Calibration / Localization
While this post is not to go into detail on how to calibrate or localize a basic understanding of how a number ended up in a field would be nice. Since this is the same basic method used through FPS the description will be posted in more detail later but this brief description can be a guide.
Typically taper is calibrated with a destructive sampling method where the tree is cut down and measured for diameter at heights up the tree. The FPS method would have the person sampling measure up the tree when the diameter increment is 1 – 2 inches with not more than 10 measurements and i believe not less than 3. so for a 10 inch tree the sampler would measure the height to 9″, 8″, 7″, 6″, 5″, 4″, 3″, 2″, 1″, top. This method deviates from the typical method of measuring at fixed heights. Both methods get the user to the same place however trees with little taper would be more efficiently measured using the FPS method.
Now that a series of measurements have been made on several trees basically the data is put into a table and data is categorized. The average value of a given cell is the resulting value found in the library. Sometimes “smoothing” algorithms may be used to make the results work as expected.
Hopefully this brief description will help people understand how FPS deals with taper. If you have any questions feel free to contact Free State Drivers for more information.