 Free State Drivers
The FSD Office Penguins get out of the office and go to the field… What were we up to in the blistering heat?
Actually we did an amazing job avoiding the heat of the inland northwest for the time we were gone. More time and penguin-power would have made this more impressive but the Office Penguins went to visit some permanent plots in the Black Hills Experimental Forest of South Dakota. If you look at the following map you can see a circle in the middle of the map. This is what is called a Nelder plot.
What is a Nelder plot?
Well they kind of unique and not often used in forestry because of the perceived difficulty in data analysis. These plots are based on individual location levels of competition. In these plots those levels of competition are made by 52 spokes and 18 arcs. The spokes are evenly spaced at 1/52 of the circle while the arcs are spaced at different distances to promote differing levels of competition. The arc spacing was found to be about (As measured from the plot center rebar and rounded to nearest foot for this post):
- 22.7
- 25
- 28
- 32
- 36
- 40
- 45
- 51
- 58
- 66
- 73
- 83
- 94
- 106
- 119
- 134
- 152
- 171
So based on the math the plots would look like this.
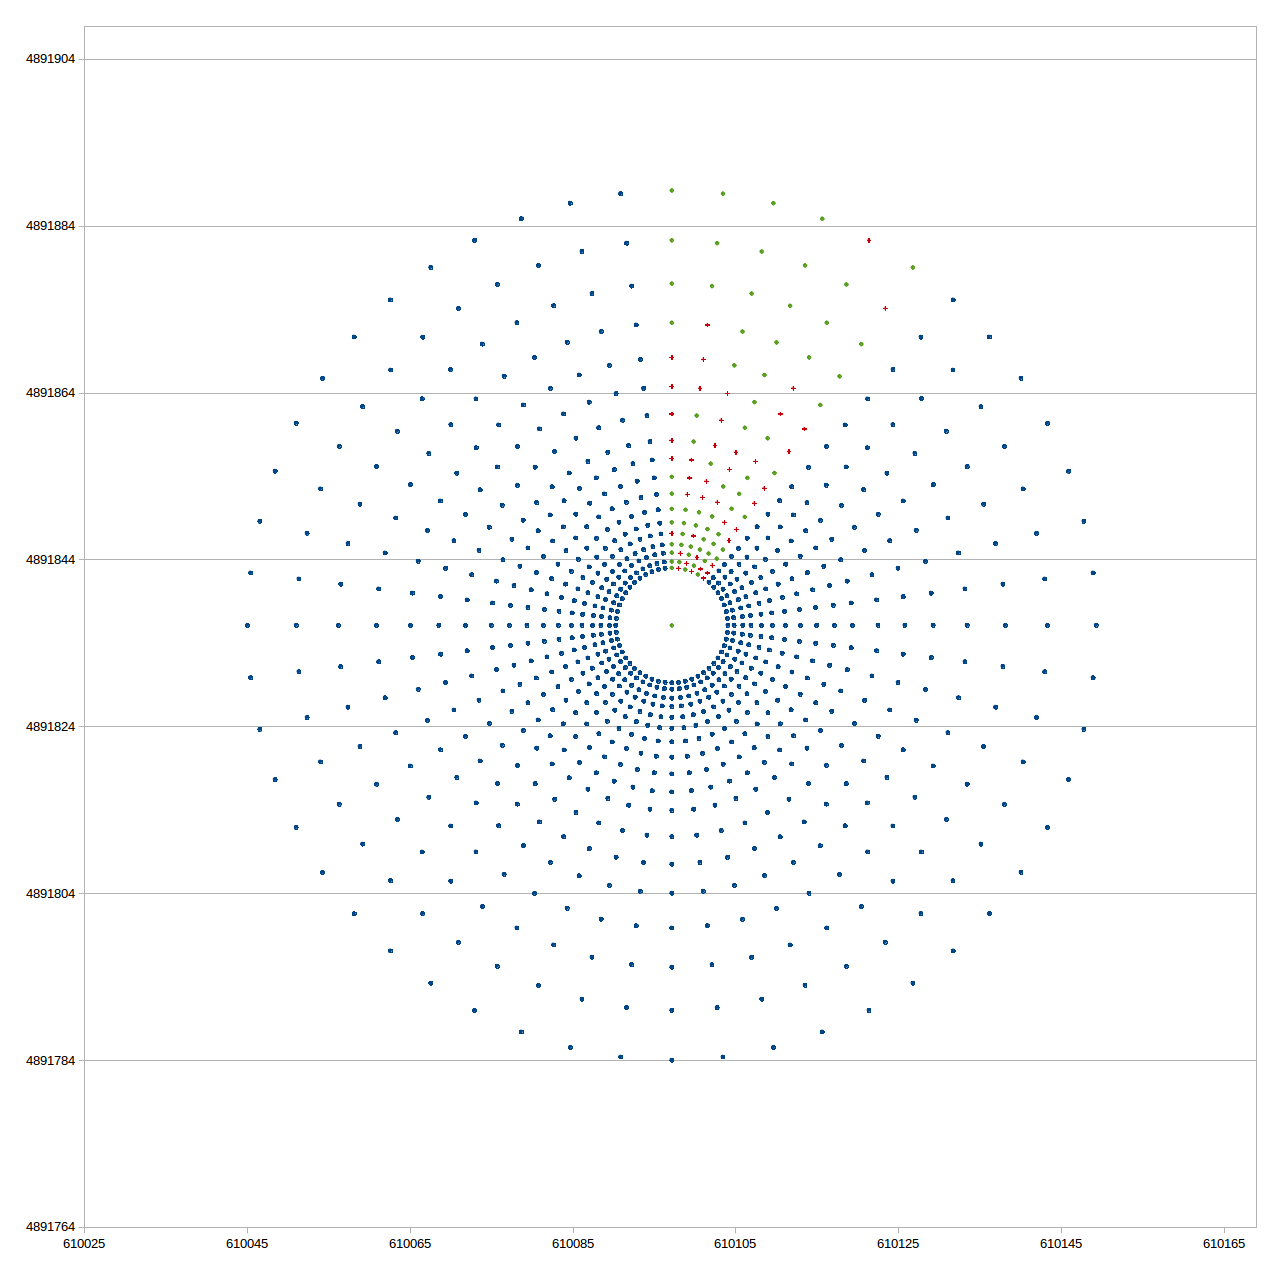
The green points are trees visited and coordinates verified and DBH measured. The Red are dead / missing trees in the visited area. The blue are the remaining trees estimated positions but not visited.
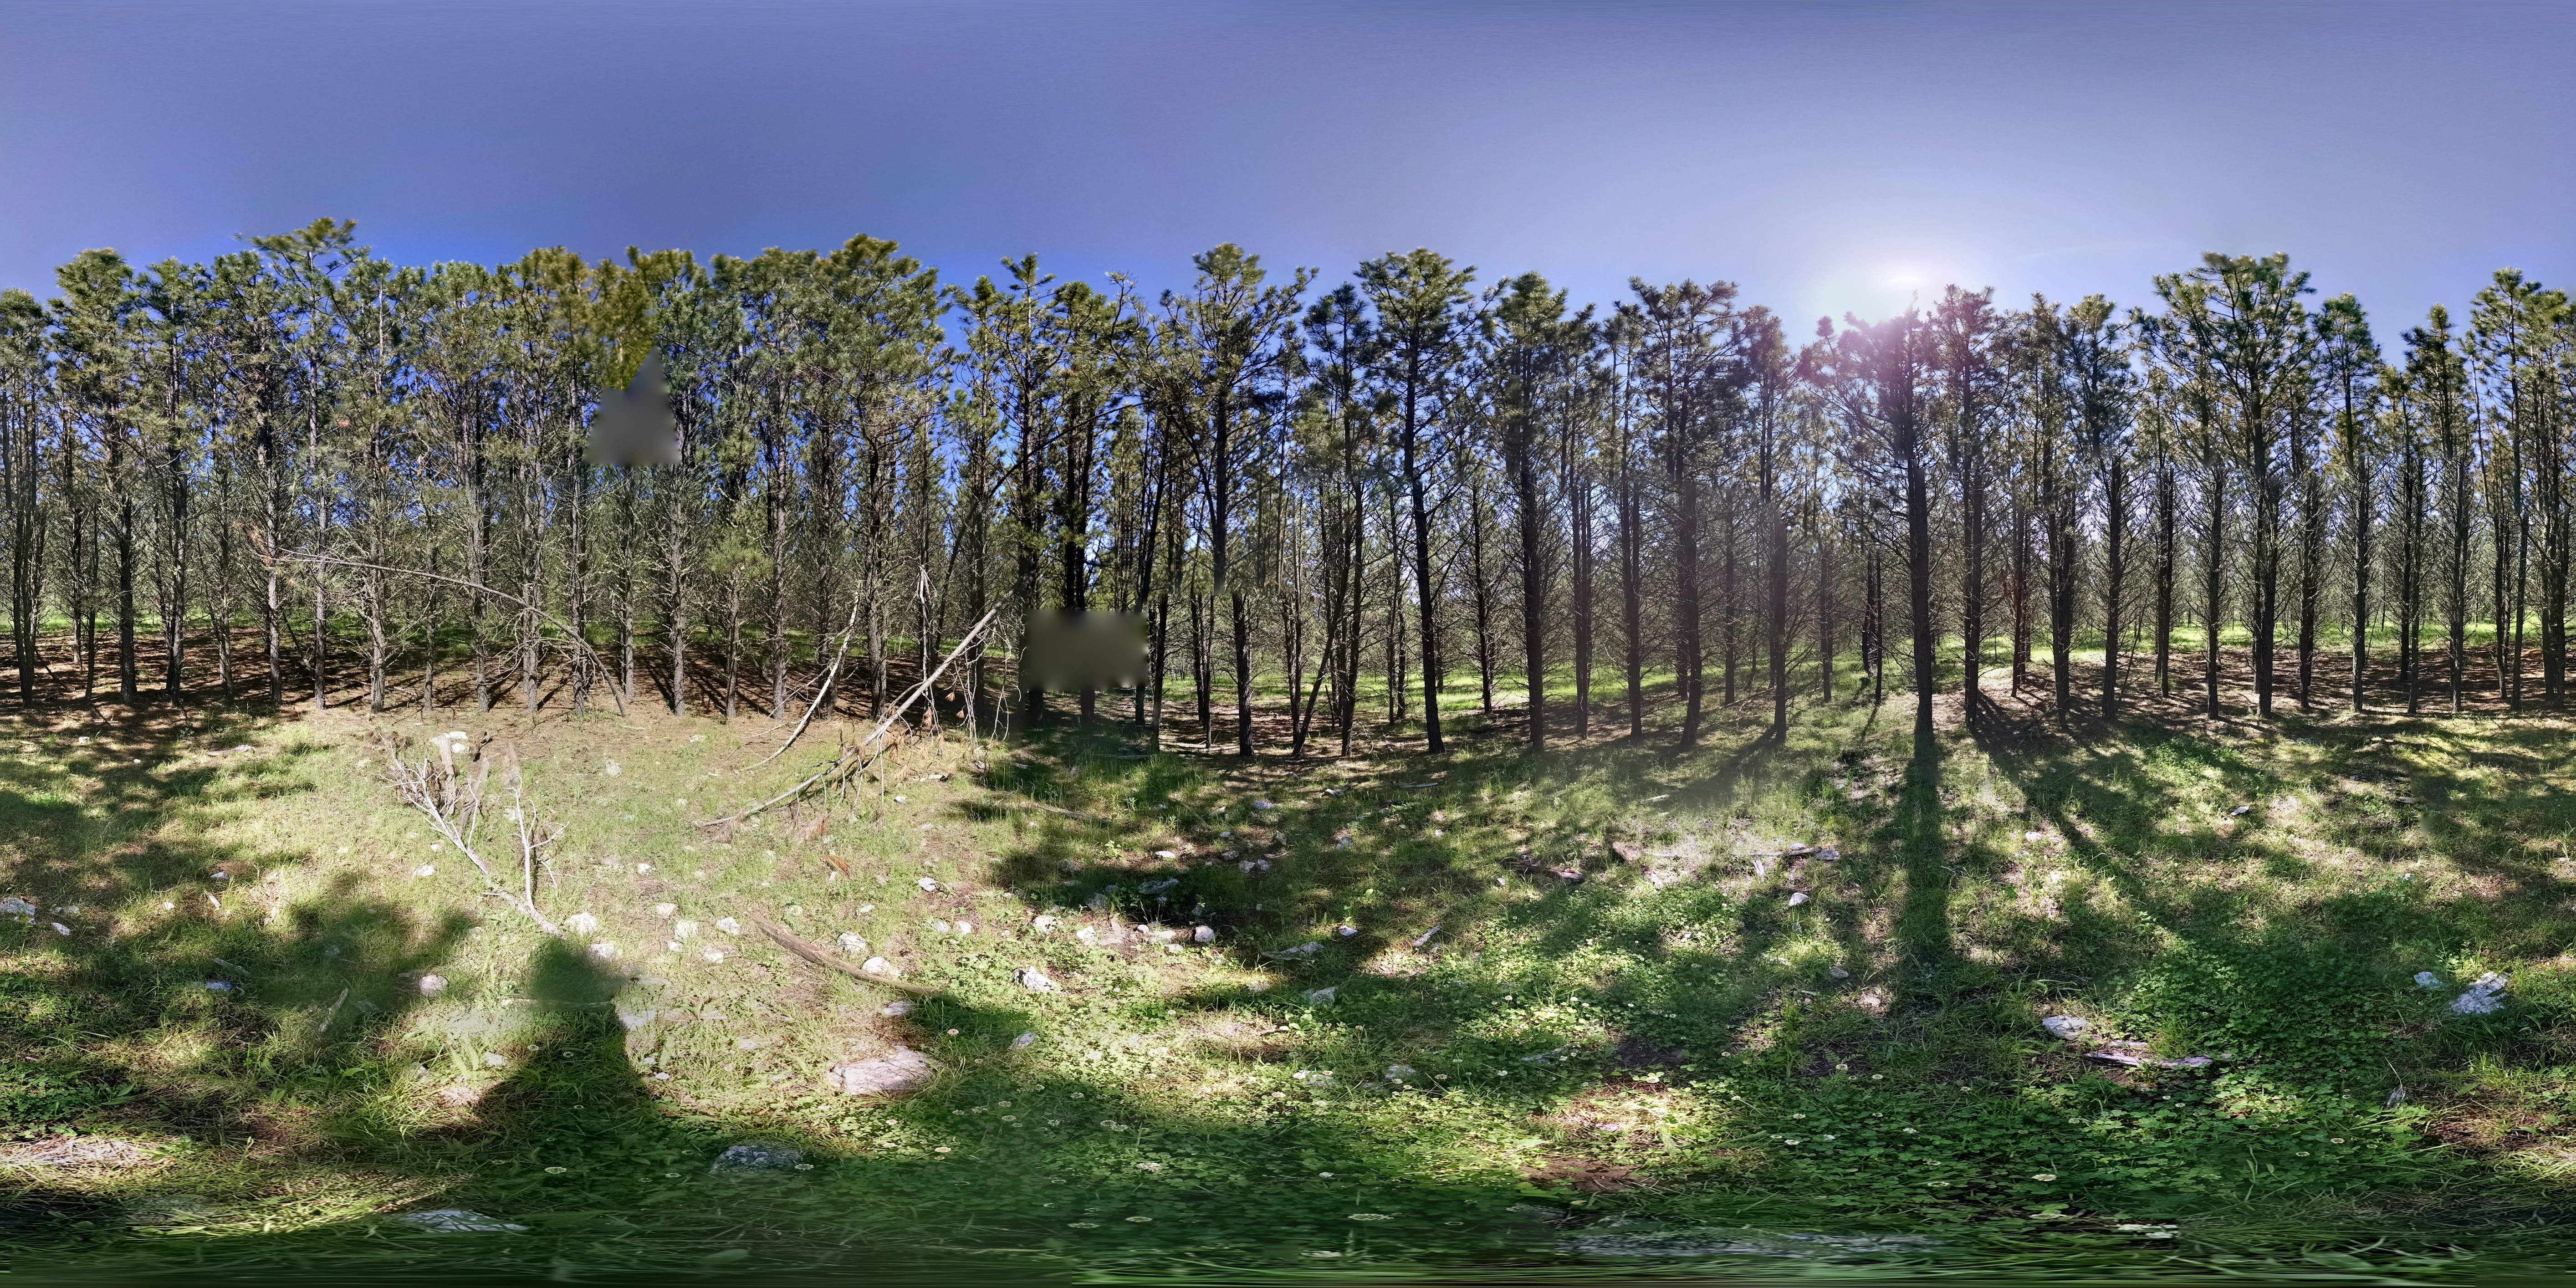
What might that look like on the ground? Take a look at the following…
Please navigate around this complete photosphere. Clicking and dragging will move you around the image.
How can this data be used?
Typically the inner and outer 1 – 2 arcs are dismissed as buffer areas. After that the competition at a given tree can be calculated as the growing space is known. This will leave you with 52 replications of 14 densities.
Some basic approximations in english units (ft & acres)…
| Arcs | Dist | Mids | SqFt/Anulus | Sqft/Tree | Spacing | TPA |
|---|---|---|---|---|---|---|
| 0.0 | 0.0 | |||||
| 1.0 | 22.7 | |||||
| 23.9 | ||||||
| 2.0 | 25.1 | 470.3 | 9.0 | 3.0 | 4,816.0 | |
| 26.9 | ||||||
| 3.0 | 28.6 | 609.9 | 11.7 | 3.4 | 3,713.9 | |
| 30.3 | ||||||
| 4.0 | 31.9 | 767.6 | 14.8 | 3.8 | 2,950.8 | |
| 34.1 | ||||||
| 5.0 | 36.2 | 978.0 | 18.8 | 4.3 | 2,316.0 | |
| 38.4 | ||||||
| 6.0 | 40.5 | 1,229.0 | 23.6 | 4.9 | 1,843.1 | |
| 43.2 | ||||||
| 7.0 | 45.8 | 1,632.1 | 31.4 | 5.6 | 1,387.8 | |
| 48.8 | ||||||
| 8.0 | 51.8 | 2,056.4 | 39.5 | 6.3 | 1,101.5 | |
| 55.1 | ||||||
| 9.0 | 58.4 | 2,518.9 | 48.4 | 7.0 | 899.2 | |
| 62.0 | ||||||
| 10.0 | 65.5 | 2,965.4 | 57.0 | 7.6 | 763.8 | |
| 69.2 | ||||||
| 11.0 | 72.8 | 4,066.7 | 78.2 | 8.8 | 557.0 | |
| 78.0 | ||||||
| 12.0 | 83.1 | 5,516.8 | 106.1 | 10.3 | 410.6 | |
| 88.5 | ||||||
| 13.0 | 93.9 | 6,559.4 | 126.1 | 11.2 | 345.3 | |
| 99.6 | ||||||
| 14.0 | 105.3 | 8,348.7 | 160.6 | 12.7 | 271.3 | |
| 112.2 | ||||||
| 15.0 | 119.0 | 10,917.9 | 210.0 | 14.5 | 207.5 | |
| 126.7 | ||||||
| 16.0 | 134.4 | 13,721.0 | 263.9 | 16.2 | 165.1 | |
| 142.9 | ||||||
| 17.0 | 151.4 | 17,483.1 | 336.2 | 18.3 | 129.6 | |
| 161.2 | ||||||
| 18.0 | 171.0 |